
Penguins
Analytics Guru Tells PHN Why Aston-Reese Deserves Heavy Praise
Believe it or not, one of the Pittsburgh Penguins was statistically a defensive beast this season. It may not seem like it, and it may have escaped your eyes, but the data caught it. Penguins winger Zach Aston-Reese was an animal worthy of serious Selke Trophy consideration, according to at least one analytics guru.
The Aston-Reese factor even extended to the Penguins blueline, and the stats for Jack Johnson weren’t good.
Pittsburgh Hockey Now chatted at length with Micah Blake McCurdy, who owns and operates HockeyViz.com, the premier hockey analytics site. You may have seen the graphs or charts which come from HockeyViz on Twitter or Facebook. Also, you may not have fully understood them. Don’t worry. We forced him to explain things so even we could understand them.
You can also follow Micah on Twitter here.
The conversation over hockey analytics has largely passed. Nearly every team in the NHL, if not all of them, have an analytics team pouring through advanced statistics to further inform coaches and general managers, who are now making multi-million dollar decisions daily. The analytics conversations have moved well beyond simple Corsi or Fenwick stats to in-depth comparisons and charts.
The Penguins fourth line drew stiff duty against the opponents’ top lines for much of the season, and coaches heavily deployed them when the Penguins were ahead. Yet, shots and scoring chances were down over 30% when Aston-Reese, Teddy Blueger, and Brandon Tanev were on the ice.
McCurdy pushed publicly pushed voters to give Aston-Reese Selke consideration, and he also dropped some extraordinary stats on us that backed up his claim. Also, we made him explain things in a jargon that even we could understand.
“When the Penguins fourth line was on the ice, the expected goals against was only 1.75 per 60 minutes, which is 32% better than the team. There was some increased activity from the wall and the point area, but in the circles … nothing,” McCurdy said. “And half of that (32% decrease) was directly attributable to Aston-Reese.”
Below, you can see the McCurdy referenced activity. For the Penguins, the blue areas are good. That means less activity. And talk about shutting down the opponent.
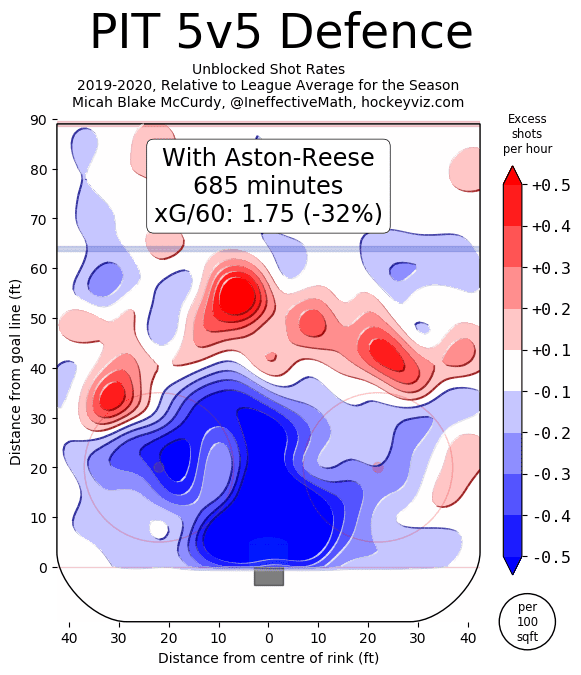
HockeyViz.com: Pittsburgh Penguins, Zach Aston-Reese
Lockdown. NOTHING happened in front of the Penguins net or the circles with Aston-Reese and the fourth line on the ice. The deep blue dead areas are the scoring zones, and they tell the story. The Penguins and Aston-Reese shut it down. What further impressed McCurdy: the above was accomplished despite heavy usage when the Penguins were ahead.
“They were heavily used when the Penguins had the lead. It’s even more impressive because teams usually give up more shots with the lead,” he asserted.
The Aston-Reese Difference
What separates analytical analysis from the eye test analysis is the attempt to answer “why?”
McCurdy made no mistake that he doesn’t delve into the “why” or “how,” but only the “what happened.”
“We can attribute half of the decrease to Aston-Reese because we can look the results when the others were utilized in different situations,” the analytics maven explained. “Blueger and Tanev did well. When they were on the ice (without Aston-Reese), (shots against) were down 5%.”
There wasn’t another player in the NHL who had such a significant impact on his team’s defensive performance. However, players such as Philadelphia Flyers Sean Couturier had more difficult competition and was an impressive 9% better than his team.
Couturier won the 2020 Selke award, and Aston-Reese finished 25th. Fellow Penguins winger Brandon Tanev finished 18th. Couturier’s reputation and offensive output, despite strong work in the d-zone, earned him the award.
Aston-Reese scored only 13 points (6g, 7a) in 57 games, which negated his chances for more serious consideration.
“I don’t think that offense should have anything to do with it,” argued McCurdy. “But of the three nominees, I would have voted for Couturier.”
The formula McCurdy used is not a simple one of counting shots or even the location of shots, but a shift-by-shift statistical analysis in which everything from shots to all five teammates on the ice is factored.
Pittsburgh Penguins Defensemen
Jack Johnson will never be a darling of the analytics community. Donald Trump has a better chance of being invited to the next Democrat convention than the advanced stats crowd praising Johnson.
Aston-Reese’s strong defensive numbers were enhanced with some members of the Penguins defensive corps, but not all.
“The numbers with Blueger and Tanev were good. When (Marcus) Pettersson and Marino were also on the ice, their numbers were very good, too,” McCurdy said before dropping the hammer. “But with Johnson, they were terrible.”
Giving up only 1.75 goals every 60 minutes would win a lot of hockey games. And for those wondering if Aston-Reese has a place on the team, perhaps the deep dive statistics will help balance the discussion.
Aston-Reese will unlikely get legitimate Selke Trophy consideration until he adds more offense to his game. Still, for those who separate the offensive and defensive statistics, Aston-Reese is a legitimate defensive star. Sure, he’s a long shot for the Selke, just like the Pittsburgh Penguins opponents are forced to take when he’s on the ice.


Pettersson Joining Team Sweden; Rakell Cites Injury

The PHN+ Q&A: Penguins Offseason, Turbulence, Trades & Reaction

Kyle Dubas’ Trade Record With Penguins: Hits & Misses

The Business of Hockey: Investments, Betting, and Policy in Canada

Dan’s Daily: Penguins Tough Decisions, New Maple Leafs ‘Built Differently’

Signs Point to Penguins Not Re-Signing Nedeljkovic; Space for Top Prospect

Here’s How Bunting Got Penguins a Home Run

Dan’s Daily: Angry Flames Goalie Trade Rumors; Penguins Change

Penguins Grades: Evgeni Malkin and What Comes Next
